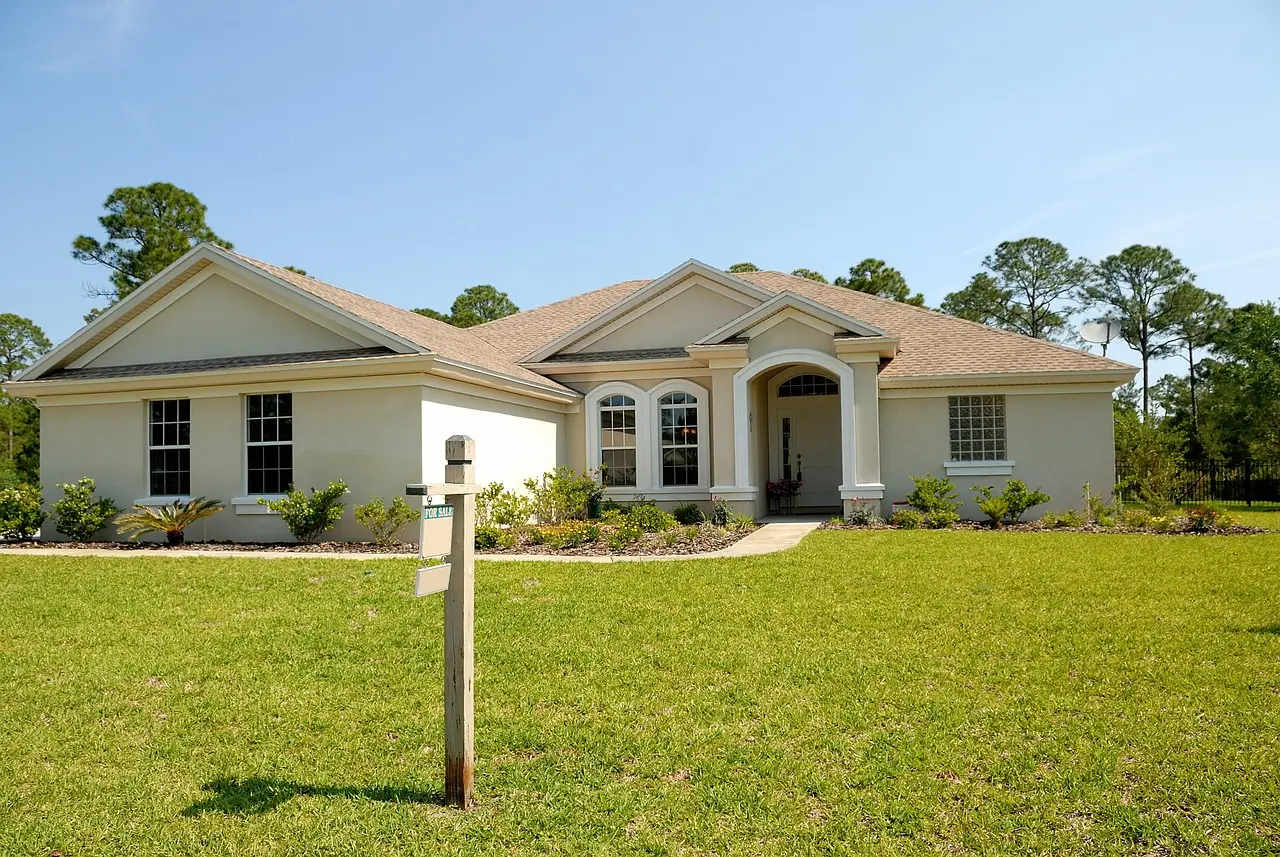
Custom Homes Grabbed 19.6% of Single-Family Starts in 2025
Custom homes hit 19.6% of single-family starts in 2025, up from 17.5%, with 182,869 units started. New England led at 47%; the West South-Central division trailed at 12.7%.
- Section
- Construction
- Author
- By Elena Vasquez
- Filed
- Length
- 2 min read
Key takeaways
- Custom homes made up 19.6% of single-family starts in 2025, up from 17.5% in 2024
- 182,869 custom homes were started in 2025, versus 176,932 in 2024
- 71.8% of 2025 single-family starts were built for sale; 8.6% built for rent
- New England had the highest custom share at 47.0%; West South-Central the lowest at 12.7%
- Quarterly data show the custom-home share flat in 2026
Custom homes accounted for 19.6% of all single-family homes started in 2025, up from 17.5% in 2024, according to the Census Bureau's Survey of Construction (SOC). That's roughly one in five new single-family houses, and the share wasn't the only thing that grew. The absolute count climbed too: 182,869 custom homes started in 2025 versus 176,932 in 2024 — about 5,900 more, or a 3% gain.
What counts as a custom home?
The definition is narrower than the marketing language suggests. A custom home, per the SOC, is a house built one at a time for owner occupancy on the owner's own land — with either the owner or a builder acting as the general contractor. The category includes both contractor-built and owner-built houses.
The alternatives are different animals entirely. Homes built for sale sit on the builder's land, often in subdivisions, and the builder intends to sell the house and land together in one transaction. Homes built for rent make up the third bucket. In 2025, those built for sale dominated at 71.8% of single-family starts, while built-for-rent homes took 8.6%. Add it up and custom construction is still a modest slice of a market geared toward production building.
Where custom building is strongest?
The geography is stark. New England posted the highest custom share of the nine census divisions: 47.0%. That means nearly half of the region's single-family starts were one-off projects for owners — a market built almost entirely outside the tract-building model.
At the other end:
- West South-Central division: 12.7%
- Mountain division: 13.7%
- South Atlantic division: 15.7%
That spread — 47% versus 12.7% — is the widest gap in the dataset, and it tracks with what builders already know: land costs, regulatory environments, and subdivision density differ sharply between New England and the Sun Belt's production-heavy markets.
What's happening in 2026?
The quarterly published statistics show the custom-home share of single-family starts has remained flat in 2026. There's a trade-off in reading those numbers, though. The quarterly figures arrive faster, but they lack the geographic detail the annual dataset provides — so the division-level picture won't refresh until the next annual release. For now, the 2025 annual data stands as the most detailed map of where owner-driven construction is gaining ground, and it shows the gains are real but unevenly distributed.
Source: eyeonhousing.org
More from Elena Vasquez
Show full bio
Senior reporter covering money, funding and market shifts around construction industry, architecture, interior design at Built Current.
366 articles