China Controls 85% of Solar Manufacturing as COP31 Tests Industrial Policy
China holds 85% of solar manufacturing and 80% of battery capacity, IEA data show, as India, the US and Europe build factories that lag upstream.
- Section
- Green Building
- Author
- By Marcus Bennett
- Filed
- Length
- 4 min read
Key takeaways
- China controls ~85% of solar PV manufacturing and >80% of lithium-ion battery capacity, per IEA Energy Technology Perspectives 2026.
- India reached 261.7 GW of module capacity but only 36.6 GW of cell capacity by June 2026; imports rose 18% year over year.
- SEIA counts $41.9 billion in US manufacturing investment since August 2022; Rhodium tracked only 3 GW of US wafer capacity in Q3 2026.
- Chinese alkaline electrolysers cost $500–1,100 per kW in 2025 versus $1,900–2,500 outside China.
- More than 90% of major Chinese solar manufacturers reported losses in 2026, with 70+ bankruptcies since 2024.
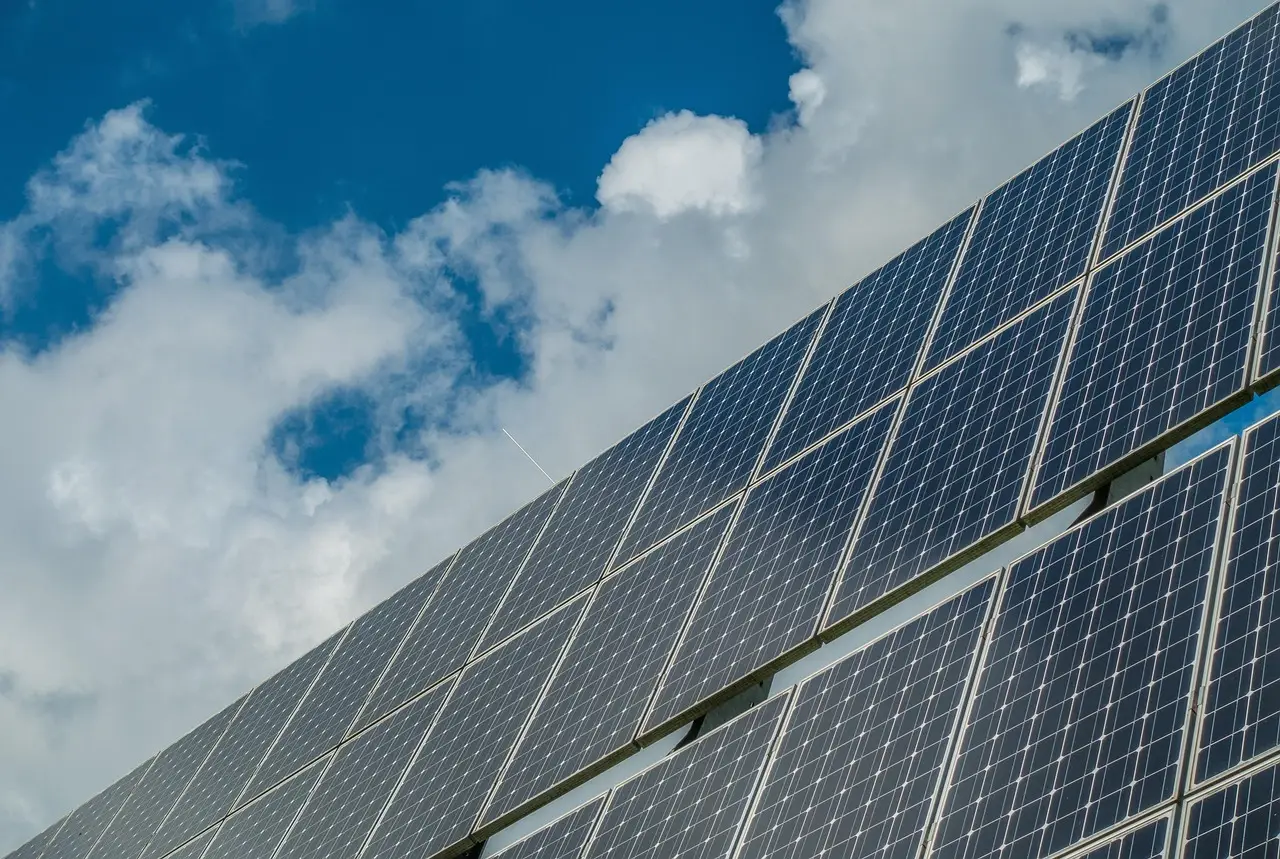
China controls roughly 85 percent of global solar photovoltaic manufacturing capacity and more than 80 percent of lithium-ion battery production, according to the International Energy Agency's Energy Technology Perspectives 2026 — a concentration that frames every supply-chain negotiation at COP31 in Antalya, Turkiye.
The dominance intensifies upstream. The IEA report puts China at approximately 95 percent of global solar wafer capacity and 97 percent of battery anode material production. Under the agency's stated-policies scenario, China's share of global solar module supply declines only from about 80 percent in 2024 to more than 70 percent in 2030, and its share of wafer and polysilicon production stays above 80 percent. The IEA estimates China remains the largest producer of solar modules and components through 2035.
For practitioners, the numbers raise one question: can subsidies, import restrictions and domestic incentives build competitive industries without inflating the cost of solar and storage projects?
What does India's capacity boom hide?
India added 50.6 GW of module manufacturing capacity and 9.7 GW of cell capacity in the first half of 2026, according to Mercom India's September 2026 assessment. By June, cumulative module capacity reached 261.7 GW against only 36.6 GW of cell capacity — nameplate module capacity sits roughly 7.2 times above cell capacity. The Approved List of Models and Manufacturers contained 225.5 GW of listed module capacity and 35.5 GW of cell capacity.
Despite the factory boom, solar cell and module imports rose 18 percent year over year in the first half of 2026. Cells accounted for 81 percent of imports; modules, 19 percent. The United States absorbed 92 percent of India's solar exports. Assembly is scaling faster than upstream manufacturing, leaving developers exposed to imported cells, wafers and polysilicon.
The IEA projects India could reach 10 percent of global module production by 2030 and 12 percent by 2035, becoming a net module exporter by 2030. These remain projections, not confirmed output.
How solid is the US build-out?
The Solar Energy Industries Association's manufacturing dashboard reports 80.6 GW of operational module capacity, 92.4 GWh of battery cell capacity, $41.9 billion in manufacturing investment since August 2022 and nearly 74,000 potential jobs. The investment figure is cumulative, not 2026 spending.
Rhodium Group's October 2026 Clean Investment Monitor, using different methodology, tracked 65 GW of operational module capacity, 20 GW of cell capacity, 3 GW of wafer capacity and 10 GW of polysilicon capacity as of the third quarter. It also identified roughly 392 GWh of operational battery cell capacity against 181 GWh of battery deployment in 2025. The study warns that company-reported capacity often exceeds actual production because factories run below nameplate. The US task is not only more factories; it is upstream materials, competitive costs and sustained demand.
Why is Europe's solar manufacturing shrinking?
Enerdata's July 2026 assessment found European module capacity had contracted to approximately 10.8 GW, with cell production limited and domestic wafer manufacturing largely gone. The European Council's 2026 industrial competitiveness assessment reports Chinese modules selling at roughly half European production cost. Only six EU member states had implemented solar procurement requirements under the Net-Zero Industry Act at the time of SolarPower Europe's September 2026 review.
Globally, module manufacturing capacity hit approximately 1,315 GW in 2025 against 643 GW of shipments — nameplate capacity more than double shipments, though shipments differ from factory output.
Where do batteries, inverters and electrolysers stand?
The IEA Global EV Outlook 2026 puts worldwide lithium-ion battery capacity above 4 TWh at the end of 2025, with China holding more than 80 percent and the EU and US around 6–7 percent each. Battery production costs in Europe and the United States run up to 50 percent higher than in China before public support. Even factories outside China depend on Chinese cathode materials, anodes and processing equipment.
Inverters offer Europe a brighter picture. The IEA's 2026 inverter supply-chain analysis estimates China at about 80 percent of global capacity, with Europe second at roughly 95 GW — 8 percent — benefiting manufacturers such as SMA Solar Technology, Siemens and Schneider Electric.
Electrolysers show the risk of overbuilding. China held nearly 70 percent of global capacity in 2025, with about 35 GW of annual capacity against domestic demand below 2 GW. Global capacity reached 58 GW with average utilization under 10 percent. Chinese alkaline electrolysers cost approximately $500–1,100 per kW in 2025 versus $1,900–2,500 per kW outside China.
Are subsidies raising renewable costs?
China itself demonstrates the hazard. The IEA Renewables 2026 report estimates more than 90 percent of major Chinese solar manufacturers reported losses in 2026, with more than 70 bankruptcies since 2024. India's domestic-content rules can lift project costs when local cells cost more than imports; US tax credits do not automatically remove import dependence.
The measure that matters, the source concludes, is subsidy cost per unit of actual factory output — not announcements or nameplate. For developers, the decisive question is whether locally made equipment hits competitive prices and reliable delivery without making solar, storage and green hydrogen projects significantly more expensive.
Source: greentechlead.com
More from Marcus Bennett
Show full bio
Correspondent covering money, funding and market shifts around construction industry, architecture, interior design at Built Current.
328 articles